Data graphics
I started doing data visualization work with an engineering education research group around 2008. The iterative process we developed to “find the story” in our data has been instrumental in shaping my approach to data graphics. You can read more about our research at https://midfield.online/.
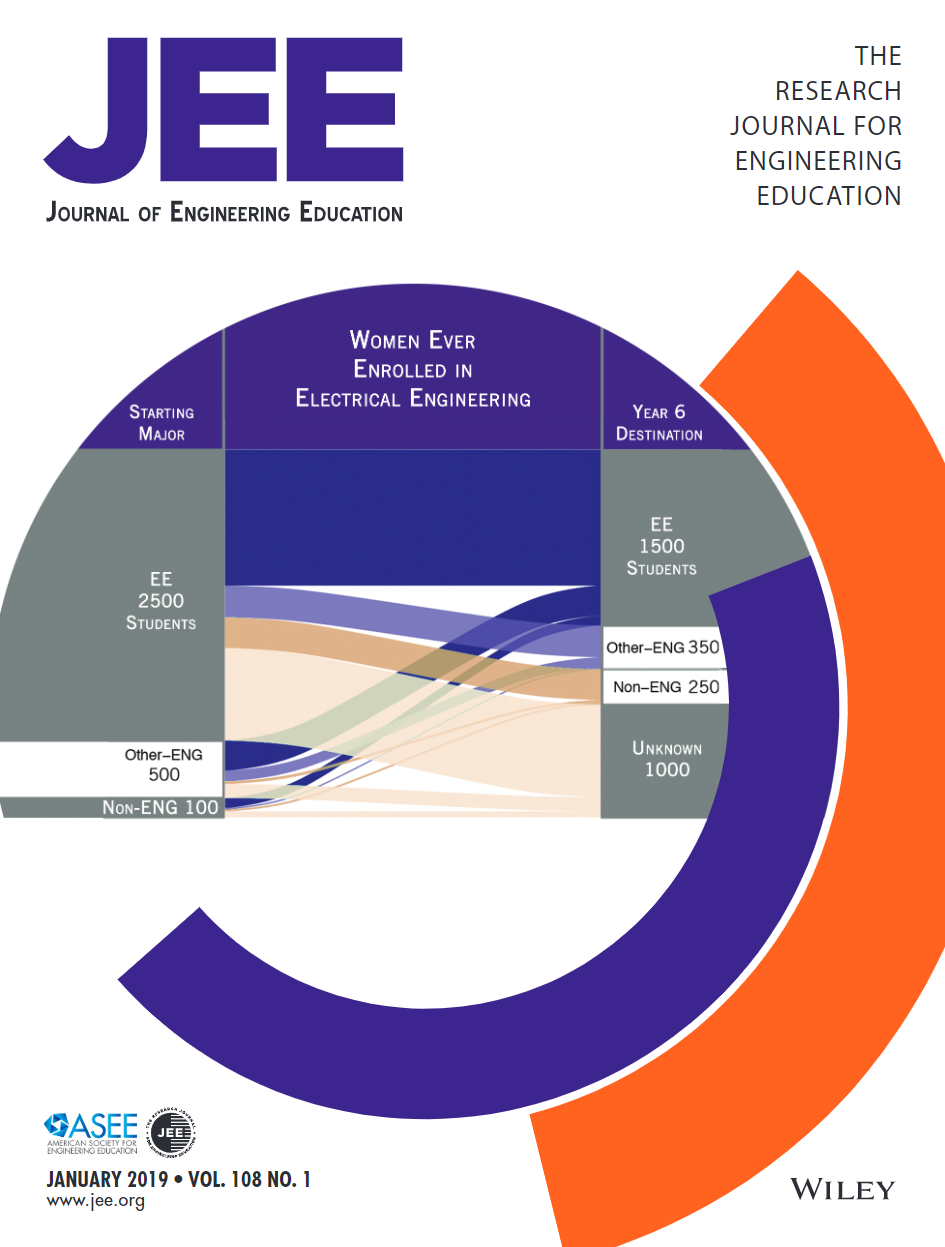
It ain’t the cover of Rolling Stone, but a Sankey diagram I made was used to inform the cover art of the journal issue in which the article appeared, with the data graphic “enhanced” by their art department.
Music
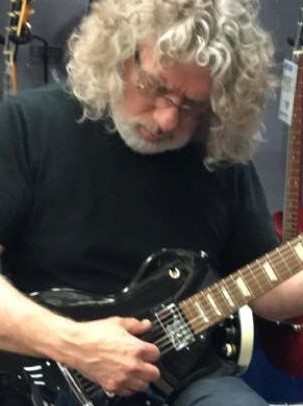
My dad was a guitar player and taught me my first chords. I’ve been songwriting and performing since my teens. A favorite musical pilgrimage is the annual Swannanoa Gathering near Asheville, NC in late July. I’ve posted some draft tracks to SoundCloud.
Brief bio
I am a Californian, born in Redding and living lots of places—Yuba City, Sacramento, Alameda, Paso Robles, and Simi Valley to name a few. I am a graduate of California State University, Northridge (1991), and the University of Washington (1993, 1995). I taught mechanical engineering courses at Rose-Hulman Institute of Technology in Terre Haute, Indiana, from 2000-2020.
I retired from teaching in 2020 and spend my time songwriting, woodworking, R data graphics consulting and blogging, and opening doors for cats who give me doleful looks when a door fails to open on perpetual summer.