Data stories workshop

Extend your graphical repertoire and enhance your ability to tell stories with data.

Welcome

The workshop has three sessions focusing on different aspects of storytelling with data.
stacked-bar chart Session 1
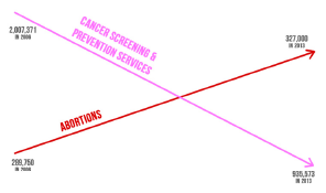
Limitations of common graph types
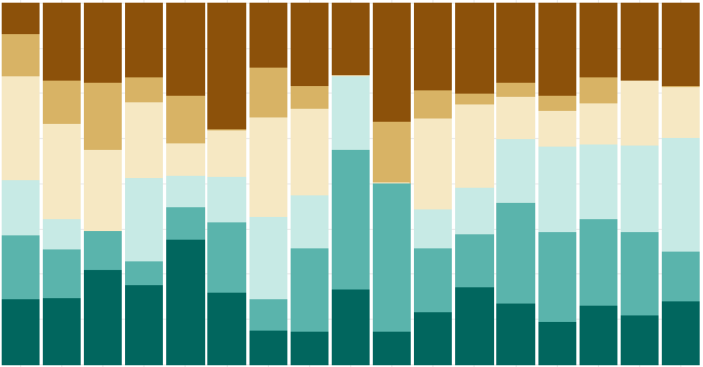
diverging stacked bar chart preview Session 2
Expanding your graphical reprtoire
stacked-bar chart Session 3
Critical thinking about visual information

Blogs to browse

The Functional Art, Alberto Cairo
Evergreen Data, Stephanie Evergreen
Visual Business Intelligence, Stephen Few
Storytelling with Data, Cole Nussbaumer Knaflic and team

MIDFIELD Institute

Slides and handouts for the 2022 MIDFIELD Institute derived from the Data Stories Workshop materials.
[slides] Graph limitations

Acknowledgments

R package authors
data.table Fast aggregation of large data, Matt Dowle and Arun Srinivasan
ggplot2 Elegant data visualizations using the grammar of graphics, Hadley Wickham, Winston Chang, et al.
distill, Scientific and technical article format for the web, JJ Allaire, Rich Iannone, et al.
xaringan Create HTML5 slides with R Markdown, Yihui Xie

Cairo, Alberto. 2019. How Charts Lie. New York: W.W. Norton.
Cleveland, William S. 1993. Visualizing Data. Summit, NJ: Hobart Press.
Doumont, Jean-luc. 2009. Trees, Maps, and Theorems. Belgium: Principiae.
Kostelnick, Charles, and Michael Hassett. 2003. Shaping Information. Carbondale, IL: Southern Illinois university Press.
Robbins, Naomi. 2013. Creating More Effective Graphs. Wayne, NJ: Chart House.
Tufte, Edward. 1983. The Visual Display of Quantitative Information. Cheshire, CT: Graphics Press.
———. 1997. Visual Explanations. Cheshire, CT: Graphics Press.
Wainer, Howard. 1997. Visual Revelations. Mahwah, NJ: Lawrence Erlbaum Assoc.
———. 2014. Medical Illuminations. UK: Oxford Univ. Press.

References

Corrections

If you see mistakes or want to suggest changes, please create an issue on the source repository.